Spreadsheet Lesson Plan Ideas for Social Studies
PART ONE: Review examples of how spreadsheets and databases can be used in learning settings. Choose four different examples and describe how they can meet your learning-teaching needs.
Spreadsheets and Data collection are an important skill that our students need to know. These tools allow you to place data and lower level information into a sheet that can be easily accessed and used later. This is evident in math class where students need to understand numbers and how to create and read charts, but this skill also lends itself well to language arts, science, and social studies.
A great tool for creating spreadsheets are Google Spreadsheets and Google Forms. I have used both of these programs, and with the current trend in education for moving schools to Google Apps For Education, more and more teachers are using these programs. While many schools may have site licenses for Microsoft Excel and Apple’s Numbers, I feel that the Google product is more user friendly. While Excel and Numbers will have more bells and whistles behind them, do you really need them in education? I think not. If you teach your students how to word process and spreadsheet manipulation, it won’t matter what program they will use later. The student will have a basic understanding and that is enough in almost every case.
A great place to find help with Google Spreadsheets and Google Forms is found at Integrating Google Tools 4 Teachers. This website has 30+ (yes I counted) different uses for Google Spreadsheets and Google Forms in education. On a side note, if you are looking for other examples/tutorials on how to use Google Apps, there are links for those as well here.
https://sites.google.com/site/colettecassinelli/spreadsheet
Now that we have identified what the tool can create, lets look at a few examples to show how these could be used in a social studies classroom.
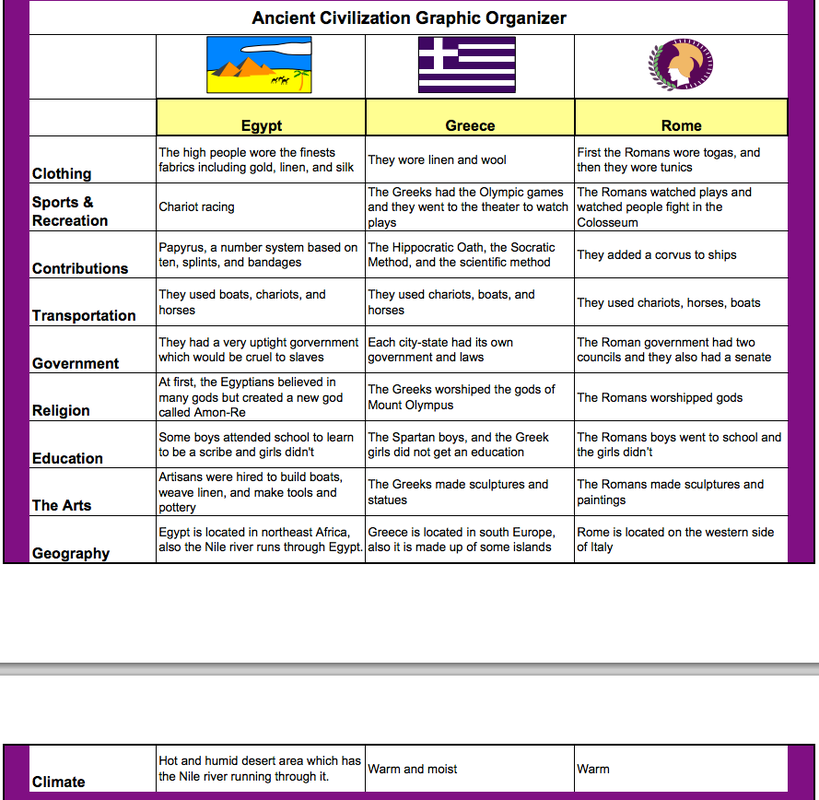
The first example is from Thinkquest. In this activity students created a spreadsheet comparing similar characteristics from three different civilizations. This chart will also help students in various ways. Whether it’s comparing and contrasting the civilizations or answering simple questions, since all of the information is organized neatly can be easily accessed and interpreted.
Spreadsheets and Data collection are an important skill that our students need to know. These tools allow you to place data and lower level information into a sheet that can be easily accessed and used later. This is evident in math class where students need to understand numbers and how to create and read charts, but this skill also lends itself well to language arts, science, and social studies.
A great tool for creating spreadsheets are Google Spreadsheets and Google Forms. I have used both of these programs, and with the current trend in education for moving schools to Google Apps For Education, more and more teachers are using these programs. While many schools may have site licenses for Microsoft Excel and Apple’s Numbers, I feel that the Google product is more user friendly. While Excel and Numbers will have more bells and whistles behind them, do you really need them in education? I think not. If you teach your students how to word process and spreadsheet manipulation, it won’t matter what program they will use later. The student will have a basic understanding and that is enough in almost every case.
A great place to find help with Google Spreadsheets and Google Forms is found at Integrating Google Tools 4 Teachers. This website has 30+ (yes I counted) different uses for Google Spreadsheets and Google Forms in education. On a side note, if you are looking for other examples/tutorials on how to use Google Apps, there are links for those as well here.
https://sites.google.com/site/colettecassinelli/spreadsheet
Now that we have identified what the tool can create, lets look at a few examples to show how these could be used in a social studies classroom.
The first example is from Thinkquest. In this activity students created a spreadsheet comparing similar characteristics from three different civilizations. This chart will also help students in various ways. Whether it’s comparing and contrasting the civilizations or answering simple questions, since all of the information is organized neatly can be easily accessed and interpreted.
http://library.thinkquest.org/J0110054/Social_Studies.html
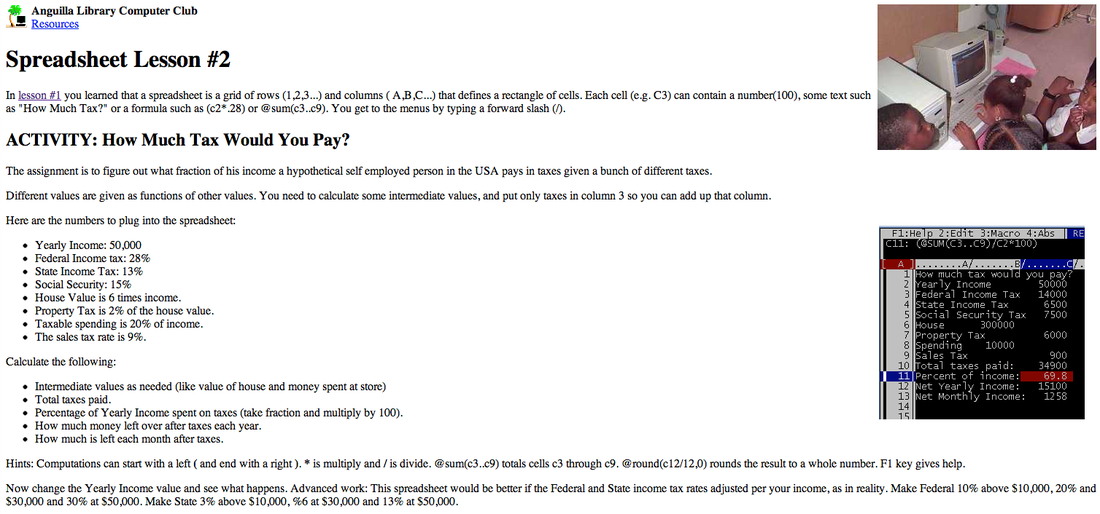
My second example is a lesson plan from a teacher who is teaching about taxes. The students need to figure out how much of their income will come out with taxes in the United States. Since I teach World Geography (my own designed course) you could have the students research other countries and their tax rates for various categories. Then compare the data and have a meaningful conversation about tax rates and what countries have because of them. A meaningful assignment all based around the collection of data.
My second example is a lesson plan from a teacher who is teaching about taxes. The students need to figure out how much of their income will come out with taxes in the United States. Since I teach World Geography (my own designed course) you could have the students research other countries and their tax rates for various categories. Then compare the data and have a meaningful conversation about tax rates and what countries have because of them. A meaningful assignment all based around the collection of data.
http://web.ai/club/spread02.html
My third and final example comes from the previously mentioned website Integrating Google Tools 4 Teachers. I facilitate a lot of workshops across the country about Flipping your classroom and many presenters have begun to post Google Forms to get an idea where the audience is coming from so they can tailor their presentation. Here is a link to such a Form. What is nice is that all the information is compiled into ONE spreadsheet. So if you have 100 people attending your session, instead of 100 charts, you only have one. I will get more into this in part two.
PART TWO: develop a spreadsheet lesson framework for your content area/grade level
As mentioned earlier, I Flipped my classroom instructional model two and half years ago and will never go back to the traditional model of teaching. But this assignment is about spreadsheets and Flipping. I use Ramsey Musallam's methodology called Explore, Flip, Apply. This has allowed me to bring more inquiry and motivate my students more in my class. So how does this relate to Spreadsheets? We can use them in the Apply phase. Here is how:
One of the units I teach is the Five Themes of Geography. Within each theme are examples of how you can see theme in everyday life. So after we Explore the topic by watching a short video on farming, then me Flipping the lesson, by creating a video explaining each theme with images, the students would need to create a spreadsheet of their theme to organize information so they can create an activity that demonstrates their understanding. This would be a class spreadsheet so that everyone will have access to the spreadsheet. Here is what it would look like.
